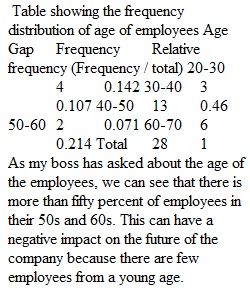
Q Week 1 Assignment 1. A boss had wanted to know if employees were in their 20s, 30s, 40s etc. Create a frequency distribution table for the following ages of employees. Include more than just frequency. Find other frequencies (like relative frequency) that you can add. Make sure the table would be ready for a business presentation (title, etc.). 40 40 60 40 50 40 60 40 40 40 20 60 30 30 40 40 30 50 40 40 20 40 60 20 60 20 60 40 2. Your new boss has asked about the ages of the employees in your department. These ages are found in question 1. What would you tell him/her about the ages of the employees? Provide him with information not only about the numbers, but also how that might impact the company in other ways. Be thorough! 3. Given this set of data, create a scatter diagram in Excel with pages on the x axis and price on the y axis. Create the chart in such a way that it clearly communicates information and is ready to be put on a Power Point slide. Before submitting, think about what all graphs need to clearly communicate information. Book Pages (x variable) Price (y variable) A 197 $5.95 B 325 $7.75 C 400 $8.50 D 462 $8.75 E 288 $7.00 F 350 $7.95 G 287 $6.95
View Related Questions